Studies of Comets in Our Solar System
Comets are composed of the most primitive, least altered materials remaining from the formation of the solar system. Generally, we may identify volatile icy materials – which become gas as the nucleus is heated by the Sun - and non-volatile ”dust” which is lifted off the surface by the sublimation process. Because most of the dust mass is in the largest dust grains, millimeter-wave emission from dust in the coma of a comet present the best opportunity to measure the total production of non-volatile materials lifted off of the nucleus as the ices sublimate. In addition, images of cometary dust emission, which can extend out for arcminutes, contain information about the history of dust production, day-night asymmetries in dust production from the nucleus, local heterogeneities of dust production from the nucleus, and with repeated observations, about the velocity of the large particles. Multi-color imaging at mm-wavelengths provides constraints on the size distribution of the ejecta particles and should reveal whether the largest particles evolve in size as they are exposed to sunlight.
Imaging in three bands with TolTEC will enrich our understanding of the behavior of the dust in the coma and improve our ability to derive the mass production rate of dust for comparison to the gas. Another exciting opportunity from this imaging will be, for the first time, direct measurement of features in the coma due to outbursts or other anisotropies from the production of dust from active regions on the nucleus. The expansion motion of the feature in the coma allows an estimate of the actual velocity of the particles to be obtained directly from the maps. This would allow one of the hardest parameters to estimate from first physical principles to be constrained by an actual measurement and would provide a fresh look into the processes at work at the surface of the comet nucleus.
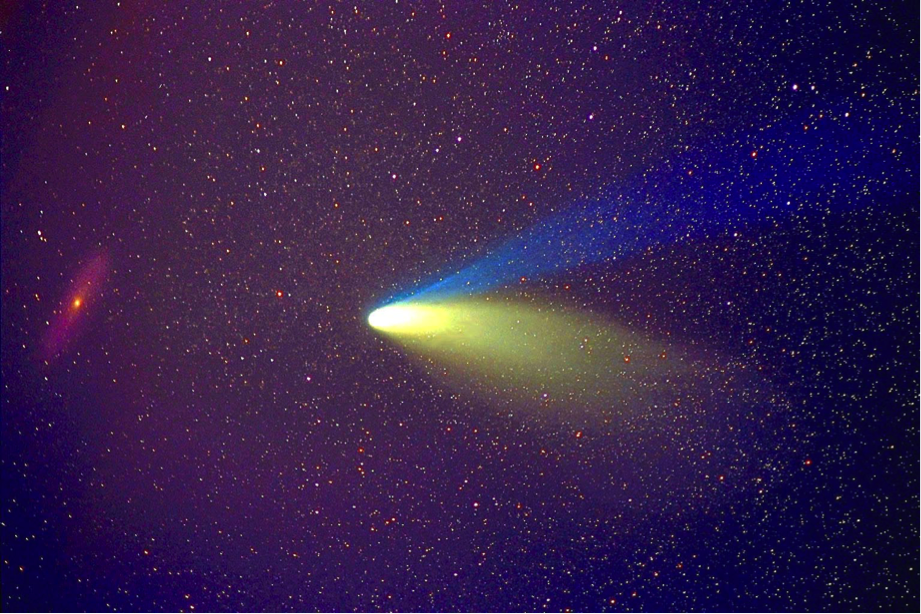
 Comet Hale-Bopp. Credit & Copyright: J. C. Casado
 Sequence of simulated images of an outburst of particles from the day side of a nucleus similar to Comet Hale-Bopp. The maps show the emission observed 2.9 days, 5.8 days, and 11.6 days after an outburst. (Credit F.P. Schloerb)